Dashboard
Dashboard is a web-based tool for monitoring, configuring and updating viaSens devices. More specifically, it allows:
- Graphical monitoring of devices' sensor values
- Configuration of various devices' properties
- LED ring control
- Viewing output log
- Checking device technical information
- Updating firmware
You can access the tool at fms.iot.sauter-cloud.com.
Graphical monitoring of sensor values
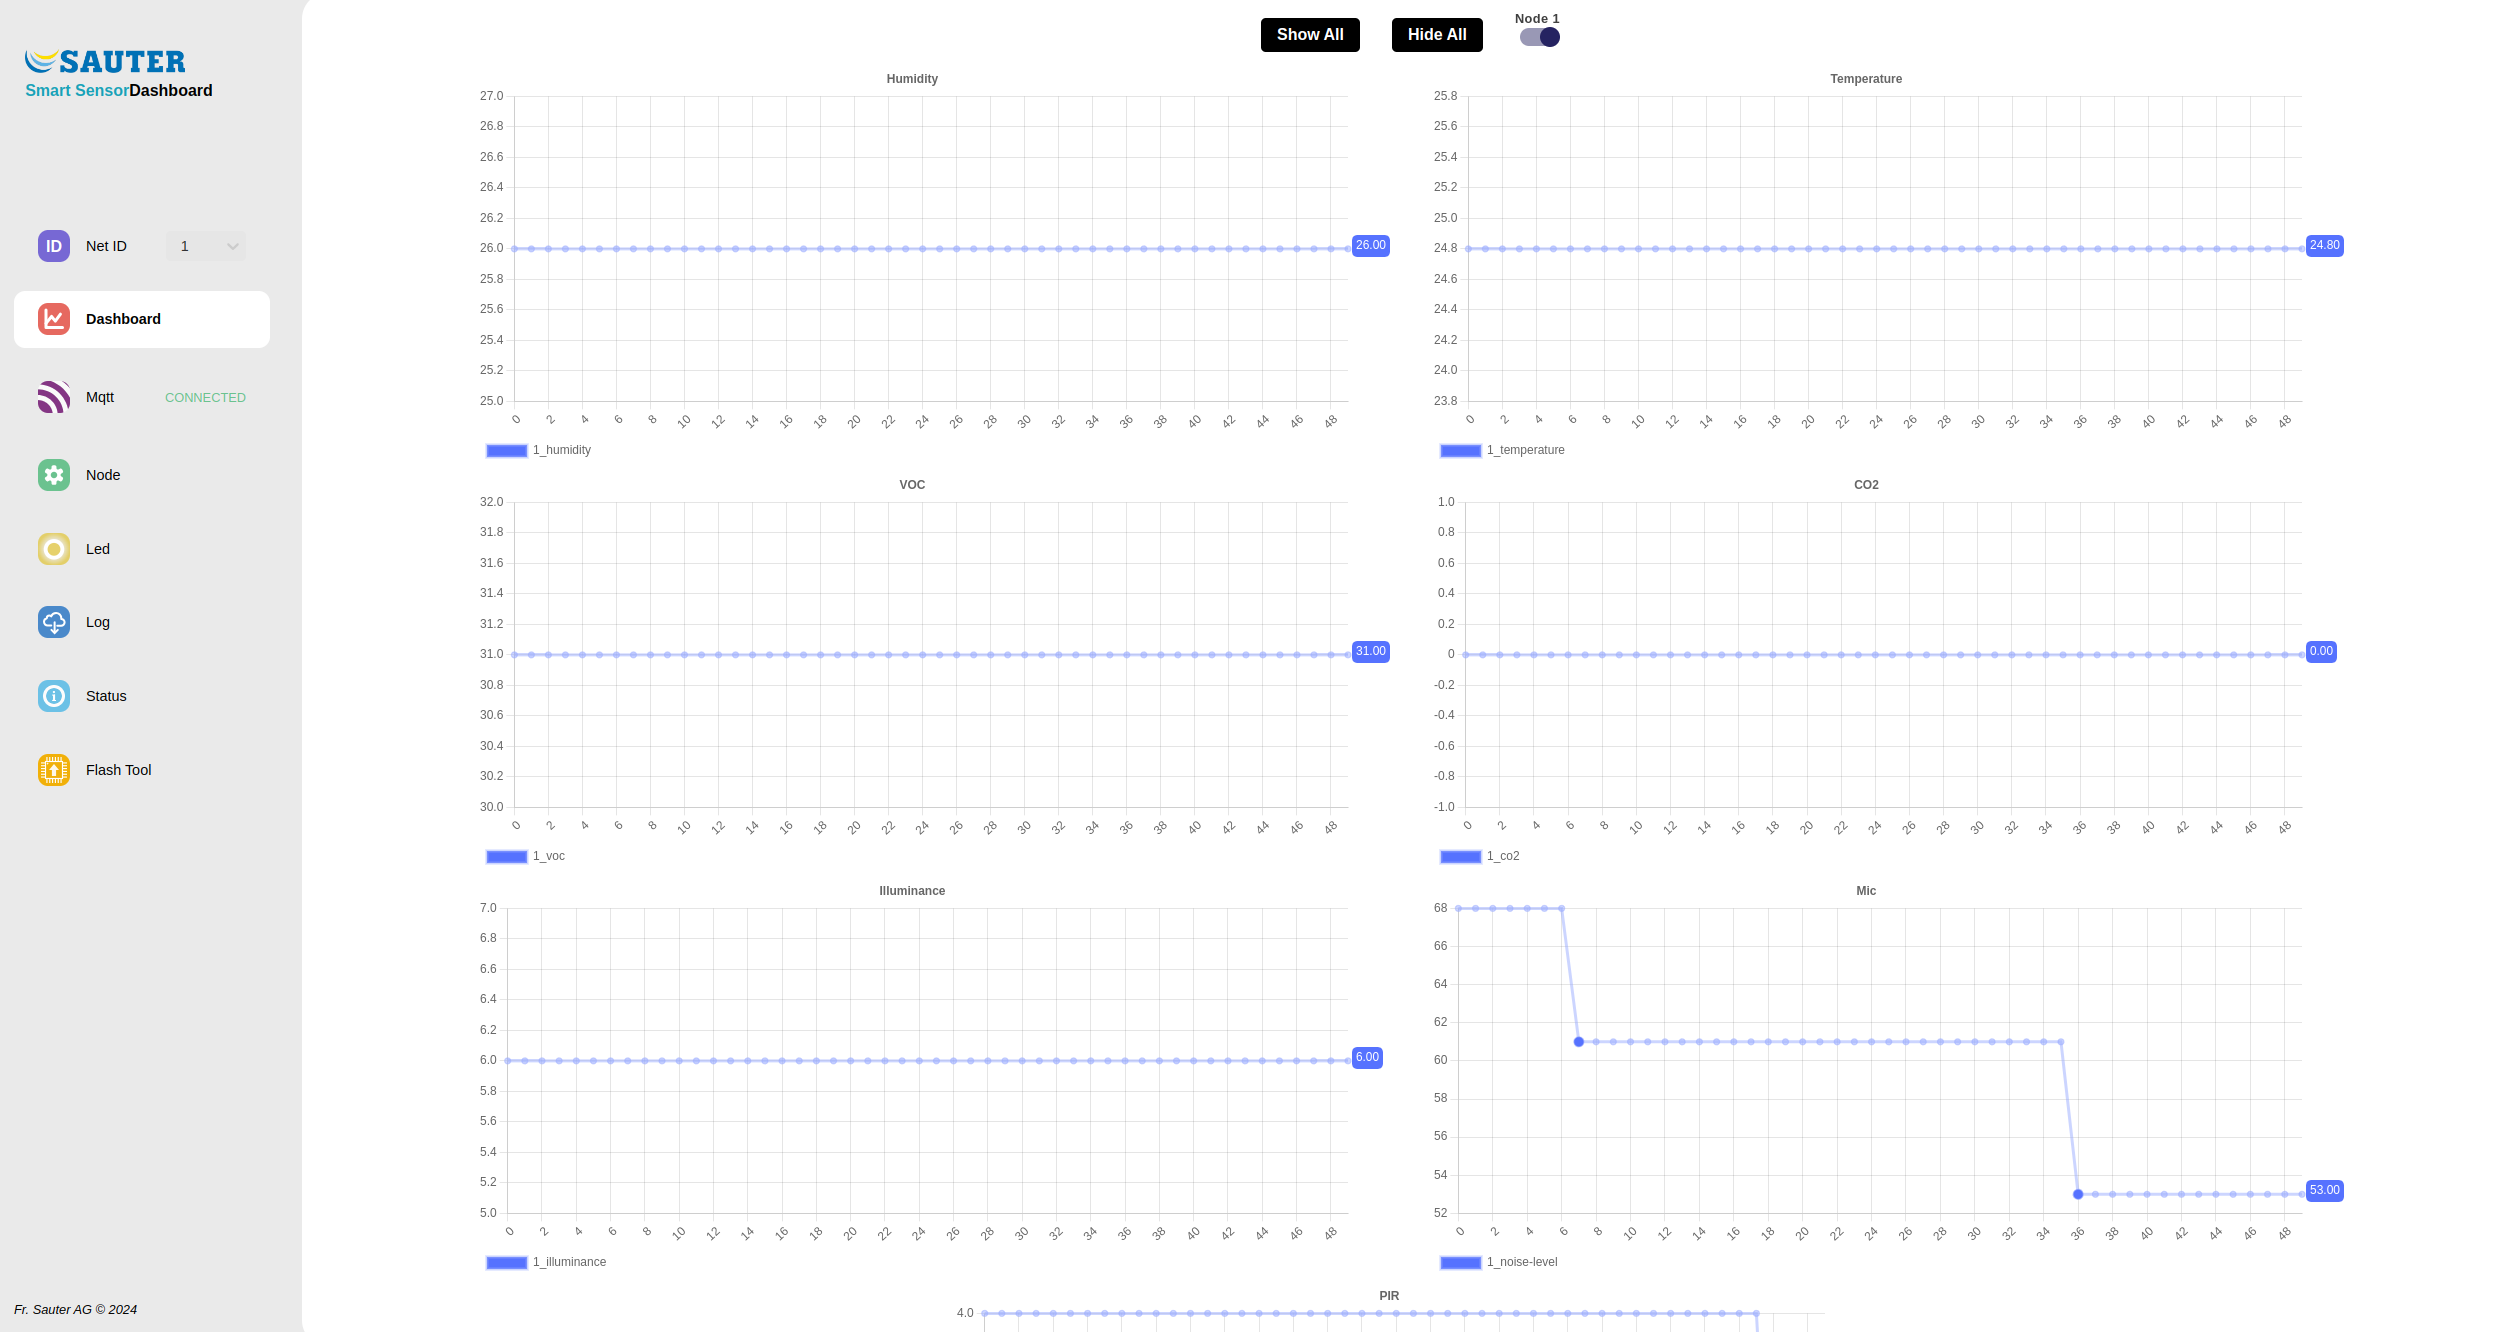
The dashboard provides a graphical representation of the sensor values of the device. You can see the data from the last 50 seconds, and you can also select which sensors you want to see.
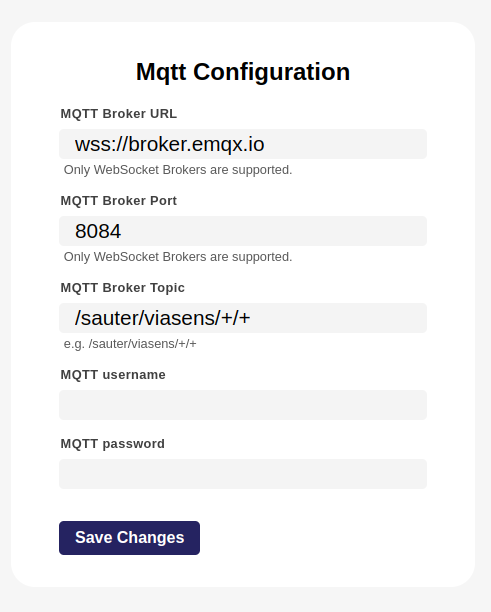
To connect your broker to the dashboard, navigate to MQTT Configuration and enter your MQTT data.
If your broker is using unsecure mqtt://, you can only connect to dashboard over HTTP. Websites hosted on HTTPS do not allow establishing unsecure connections in the background (HTTP, WS), only secure (HTTPS, WSS).
After connecting to your MQTT broker, you can select the network & device you want to monitor and see the sensor values. Network is selected in the Net ID card on the left sidebar, and devices are selected with toggle switches on the top of the screen.
Node configuration
You can configure various properties of the device in the Node card. You can change COV, report time & dead time for each sensor (except for occupancy).
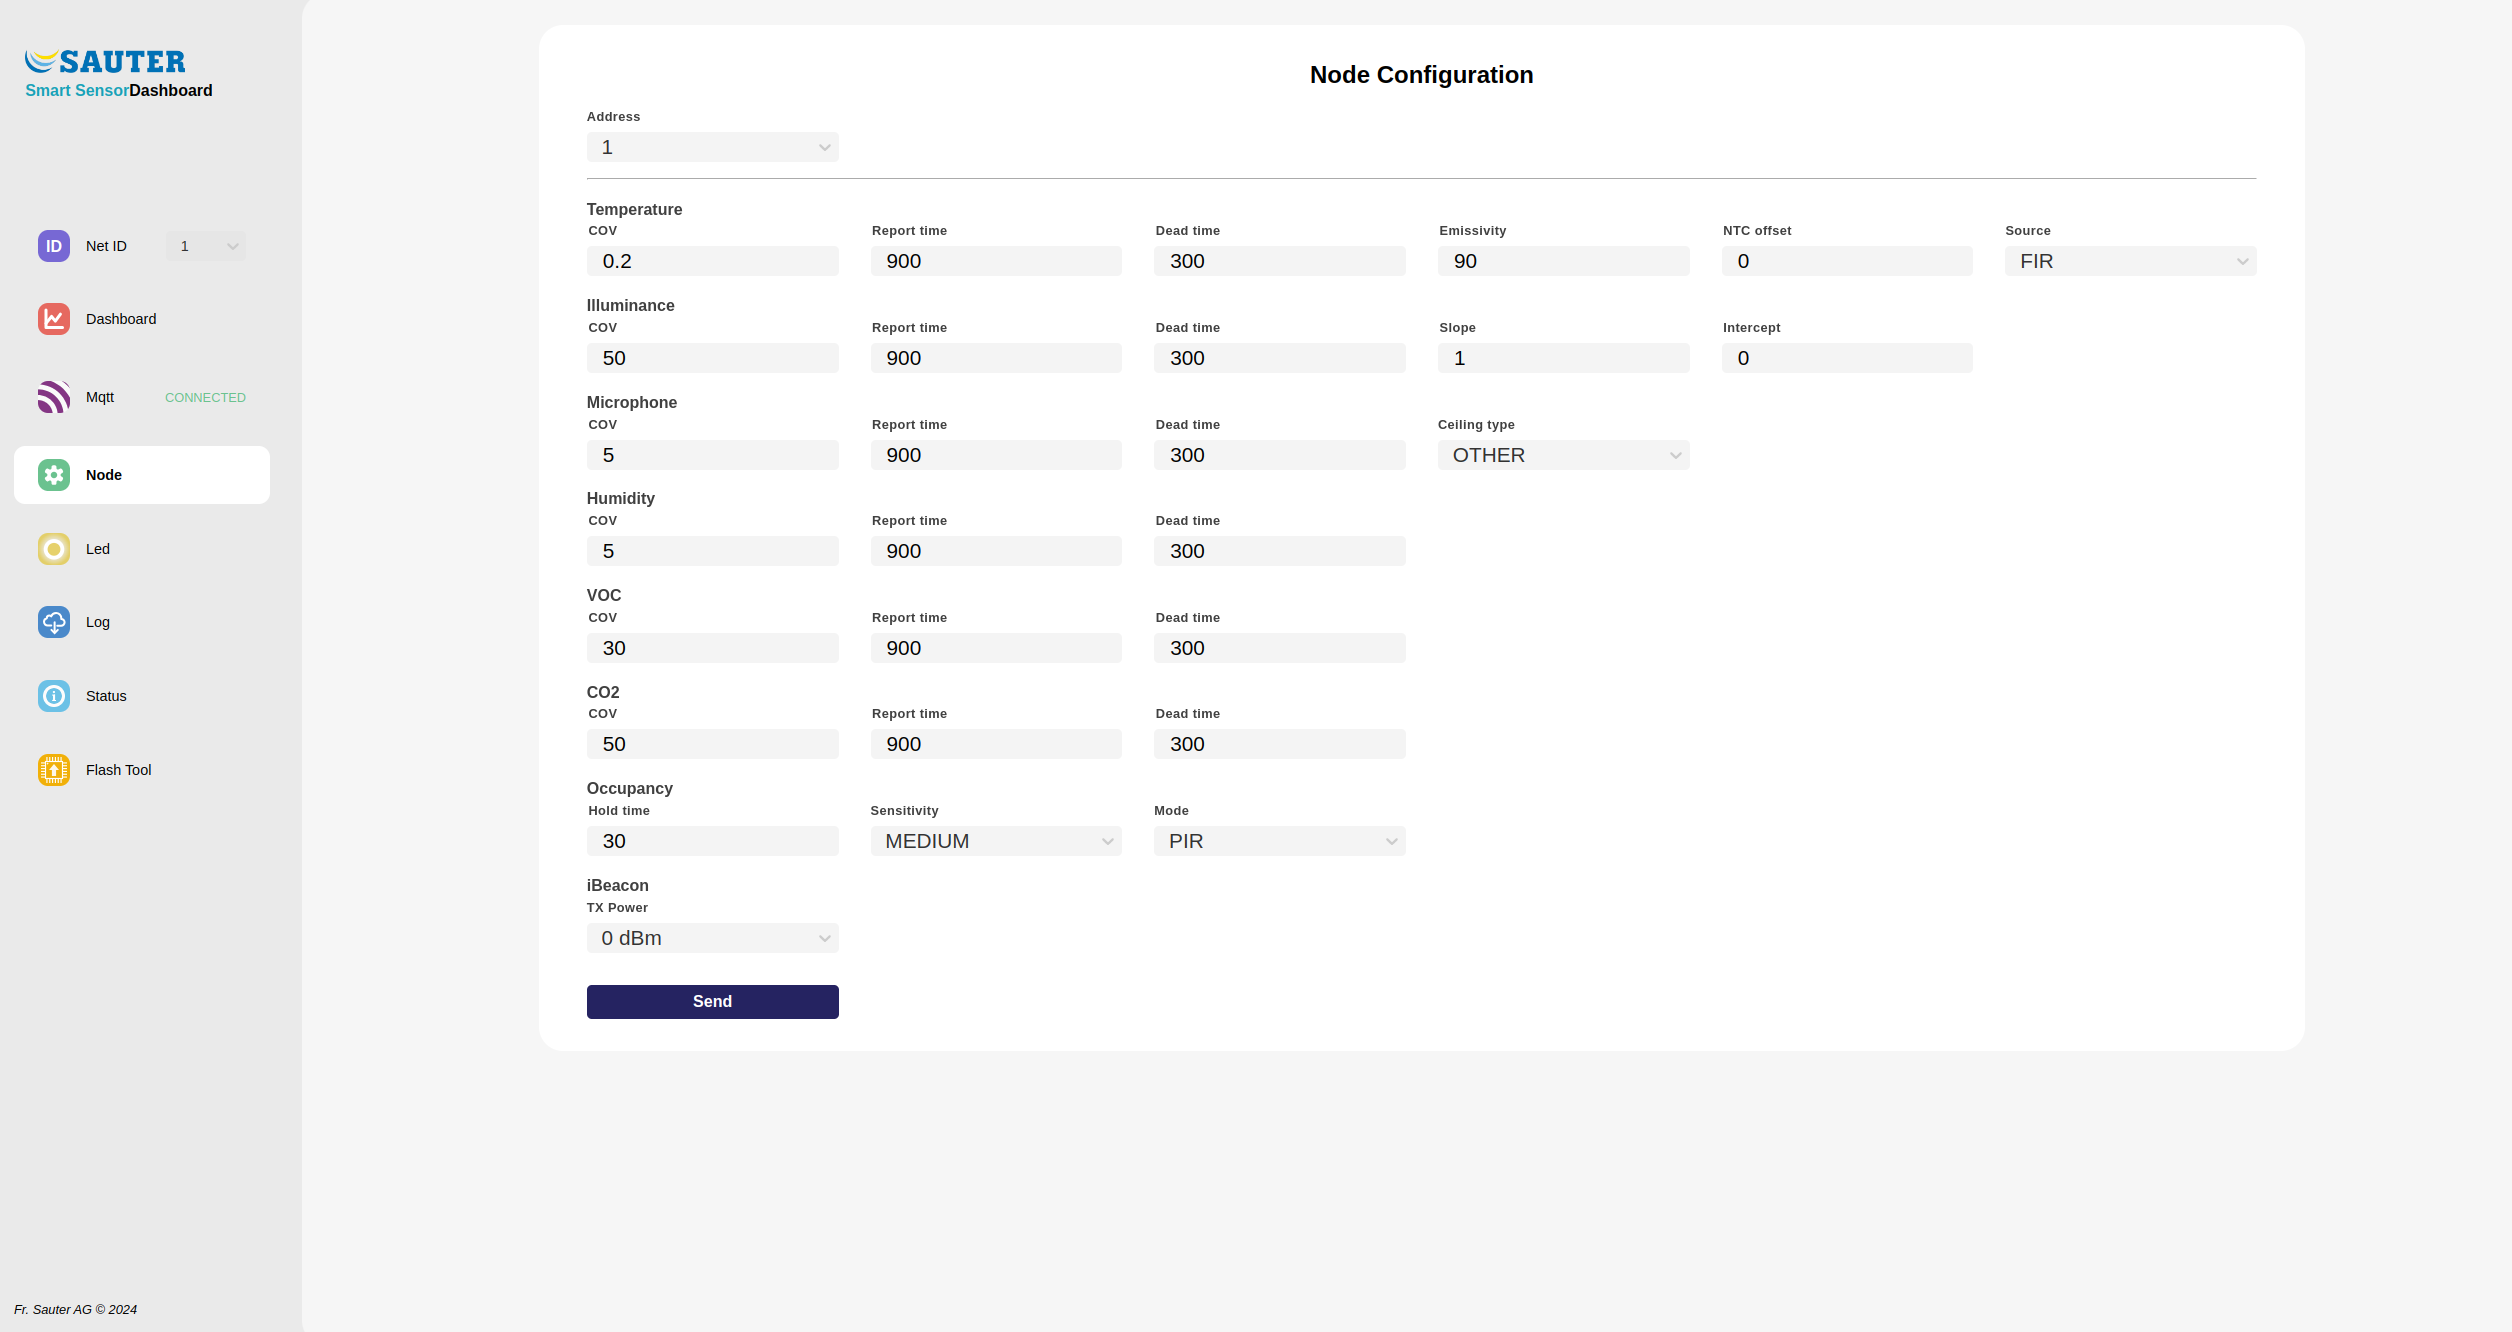
Additionally, emissivity, NTC offset & source can be changed for temperature sensor, slope & intercept for light sensor, and ceiling type for microphone. Occupancy sensor allows changing the hold time, sensitivity, and mode. Finally, iBeacon's TX power can be changed.
LED ring control
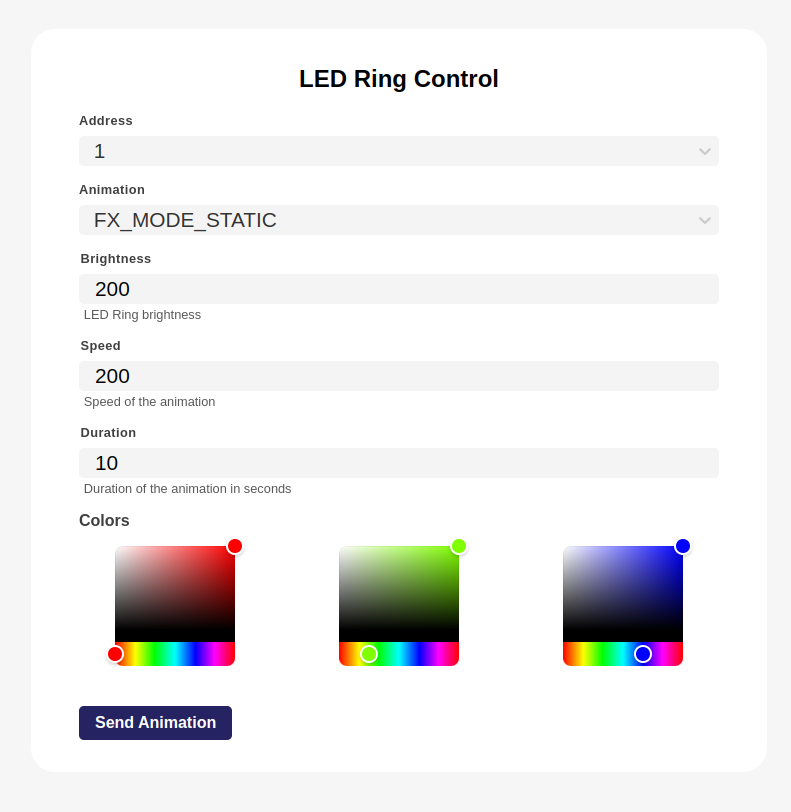
LED ring control card enables control of the LED ring on the device. You can change the colours, animation type, brightness, speed and duration of the LED ring animation.
Output log
Output log card enables the download of the MQTT data sent by the devices to the broker in the JSON format.
Device status
Status card shows the device's address, firmware version, FFID, serial number, and boot count.
Updating through the dashboard
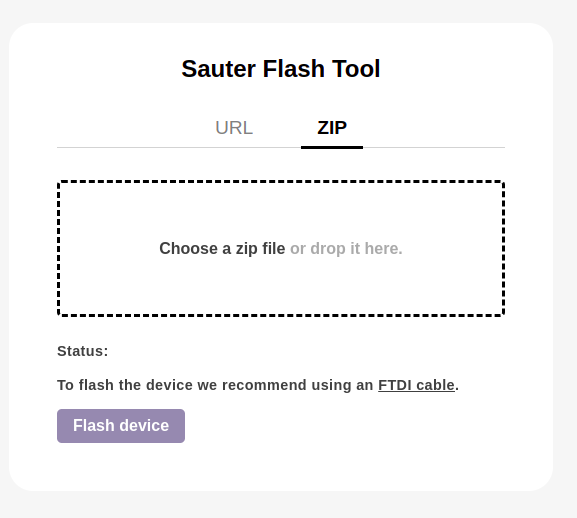
Smart Sensor Dashboard flash tool is available at fms.iot.sauter-cloud.com/flash.
Unlike mobile app OTA update, dashboard update enables both firmware upgrade and downgrade. FTDI cable is needed for updating over the dashboard.
You can update:
- by selecting automatically fetched latest release or prerelease
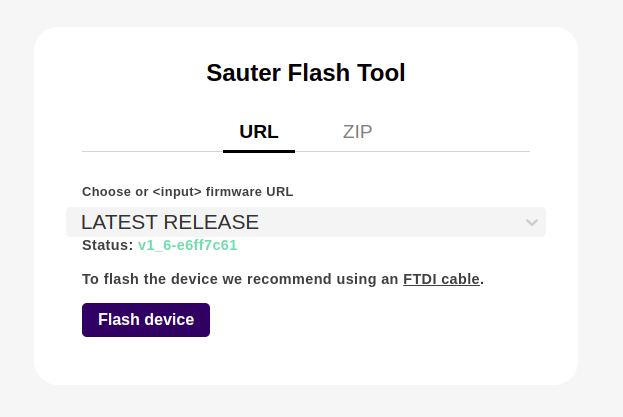
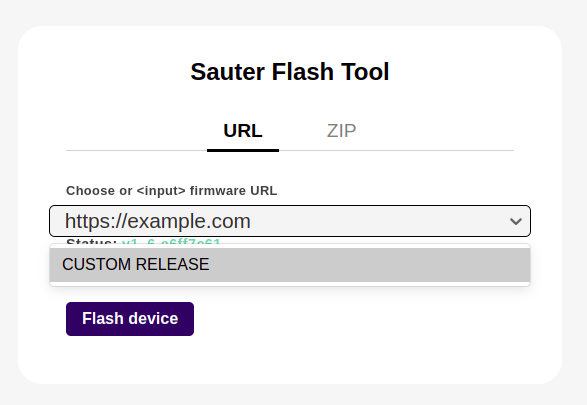
- by inputting your own URL
- by uploading firmware ZIP file (which consists of 4 binary files: bootloader, partition-table, ota and app + offset)
